7.9 Writing and amending algorithms
This topic brings the whole chapter together. You need to turn a clearly stated problem into a readable algorithm, choose suitable methods, test it with appropriate data, identify errors and amend the solution until it works correctly.
A structured method for producing an algorithm
The textbook gives a sequence of stages that should be followed when producing an algorithm for a problem. The order matters because a good solution starts with understanding the problem before any pseudocode or flowchart is written.
| Stage | What you should do |
|---|---|
| 1 | Specify the problem clearly. State the purpose of the algorithm and the tasks it must complete. |
| 2 | Decompose the problem. Break it into smaller sub-problems. Typical parts include setup, input, processing, permanent storage if required, and output. |
| 3 | Plan the data. Decide how data will be obtained and stored, what processing will happen to it, and how the results will be displayed. |
| 4 | Design the structure. A structure diagram can show the system and its sub-problems clearly. |
| 5 | Choose the representation. Construct the algorithm as a flowchart or as pseudocode, unless the question specifies which one to use. |
| 6 | Write it precisely and readably. Use meaningful identifiers and exact conditions. For example, Counter >= 10 is precise; a vague phrase such as “Counter ten or over” is not suitable pseudocode. |
| 7 | Test the algorithm. Use suitable normal, abnormal and boundary data. Dry run it and record results in trace tables where appropriate. |
| 8 | Correct and retest. If testing reveals an error, amend the algorithm and repeat the testing process until the solution behaves as required. |
Making an algorithm easy to understand
The source revisits the algorithm that selects the largest and smallest values from ten numbers. It shows the same idea using a structure diagram and a more readable flowchart.
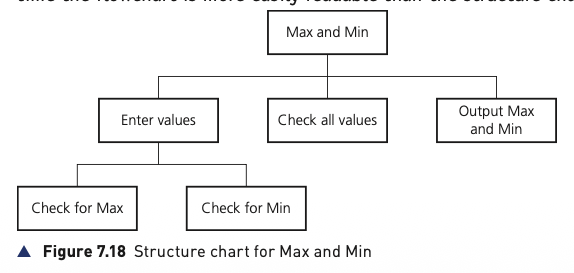
The structure chart separates the overall task into entering values, checking all values, checking for the maximum, checking for the minimum, and outputting the results.
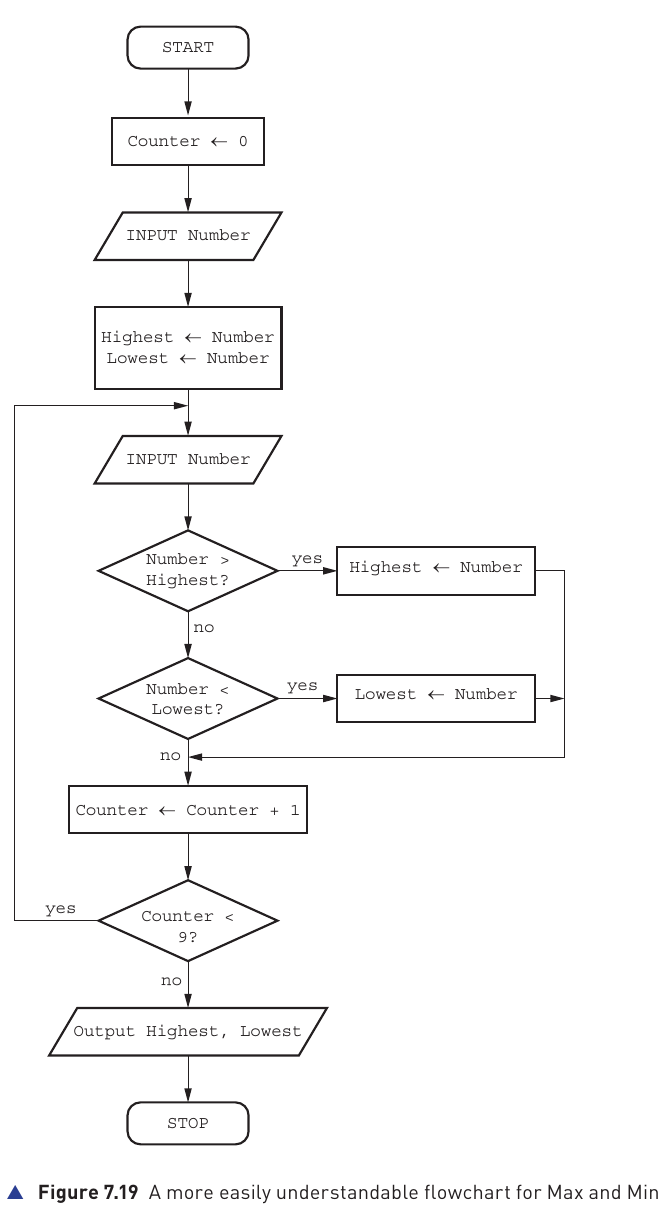
The flowchart is more detailed. It reads the first number, stores it as both Highest and Lowest, then reads the remaining values. Each new number is compared with the current highest and lowest. After all ten values have been handled, the two results are output.
Highest, Lowest and Number make the purpose of the algorithm easier to recognise than single-letter names.Worked example 1: concert ticket cost
Tickets cost $20 each. Buying 10 or more tickets gives a 10% discount; buying 20 or more gives a 20% discount. A single transaction can contain no more than 25 tickets.
A suitable pseudocode solution first validates the quantity, then selects the correct discount, calculates the final cost and outputs the result:
REPEAT
  OUTPUT "How many tickets would you like to buy?"
  INPUT NumberOfTickets
UNTIL NumberOfTickets > 0 AND NumberOfTickets < 26

IF NumberOfTickets < 10
  THEN
    Discount ← 0
  ELSE
    IF NumberOfTickets < 20
      THEN
        Discount ← 0.1
      ELSE
        Discount ← 0.2
    ENDIF
ENDIF

Cost ← NumberOfTickets * 20 * (1 - Discount)
OUTPUT "Your tickets cost ", Cost
Testing the ticket algorithm
| Test values | Why they matter | Expected result |
|---|---|---|
| 0, 26 | Outside the permitted range | Rejected |
| 1, 25 | Lowest and highest accepted quantities | $20 and $400 |
| 9, 10 | Either side of the 10-ticket discount boundary | $180 and $180 |
| 19, 20 | Either side of the 20-ticket discount boundary | $342 and $320 |
Notice that the most useful tests are not just random numbers. They deliberately check the permitted limits and the exact points where the discount rule changes.
Worked example 2: processing school test marks
A school has 600 students and four tests: Maths, Science, English and IT. Each test is marked out of 100. The required output is the highest, lowest and average mark for each subject and also the highest, lowest and average across all four tests.
This problem needs nested loops: the outer loop handles the four subjects and the inner loop handles all 600 students for the current subject. Separate subject totals and limits are reset for each subject, while the overall totals and limits continue across all 2400 marks.
// initialise overall values
OverallHighest ← 0
OverallLowest ← 100
OverallTotal ← 0

FOR Test ← 1 TO 4
  // initialise values for the current subject
  SubjectHighest ← 0
  SubjectLowest ← 100
  SubjectTotal ← 0

  CASE OF Test
    1 : SubjectName ← "Maths"
    2 : SubjectName ← "Science"
    3 : SubjectName ← "English"
    4 : SubjectName ← "IT"
  ENDCASE

  FOR StudentNumber ← 1 TO 600
    REPEAT
      OUTPUT "Enter Student ", StudentNumber,
             " mark for ", SubjectName
      INPUT Mark
    UNTIL Mark < 101 AND Mark > -1

    IF Mark < OverallLowest THEN OverallLowest ← Mark
    IF Mark < SubjectLowest THEN SubjectLowest ← Mark
    IF Mark > OverallHighest THEN OverallHighest ← Mark
    IF Mark > SubjectHighest THEN SubjectHighest ← Mark

    OverallTotal ← OverallTotal + Mark
    SubjectTotal ← SubjectTotal + Mark
  NEXT StudentNumber

  SubjectAverage ← SubjectTotal / 600
  OUTPUT SubjectName
  OUTPUT "Average mark is ", SubjectAverage
  OUTPUT "Highest mark is ", SubjectHighest
  OUTPUT "Lowest mark is ", SubjectLowest
NEXT Test

OverallAverage ← OverallTotal / 2400
OUTPUT "Overall average is ", OverallAverage
OUTPUT "Overall highest mark is ", OverallHighest
OUTPUT "Overall lowest mark is ", OverallLowest
How to test such a large algorithm
Dry running all 2400 inputs would be impractical. The textbook recommends reducing the scale for testing — for example, use 5 students and 2 subjects. The loop limits and average divisors must be changed consistently, then a small set of carefully chosen marks can be traced by hand and the expected results compared with the actual results.
Choosing loop structures when writing algorithms
The chapter ends its core algorithm-writing practice by asking for two closely related solutions:
| Task | Suitable loop idea | Reason |
|---|---|---|
| Input exactly ten positive numbers, then find the total and average. | FOR ... TO ... NEXT | The number of repetitions is known in advance. |
Input any number of positive numbers, stopping when the user enters -1. | REPEAT ... UNTIL or another condition-controlled loop | The number of values is not known before input begins; a sentinel value ends the sequence. |
For the second task, the sentinel -1 tells the algorithm that input has finished. It must not be included in the total or count. The algorithm also needs a counter so that the average can be calculated from Total / Count.
Extension: Abstract Data Types, stacks and queues
The textbook includes an extension for students considering further study. An Abstract Data Type (ADT) is a collection of data together with a defined set of operations that can be performed on that data.
Two important examples are stacks and queues:
| ADT | Principle | Add operation | Remove operation |
|---|---|---|---|
| Stack | LIFO — Last In, First Out | Push | Pop |
| Queue | FIFO — First In, First Out | Enqueue | Dequeue |
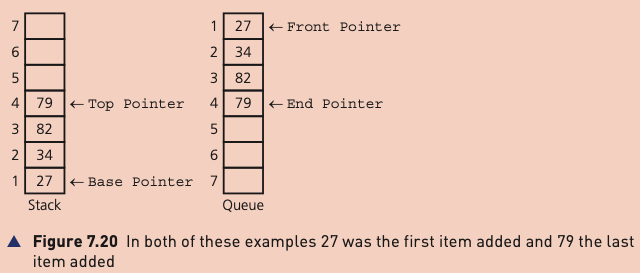
Stack pointers and operations
A stack has a Base Pointer and a Top Pointer. In the example, the Base Pointer remains at the base while the Top Pointer changes when items are pushed or popped.
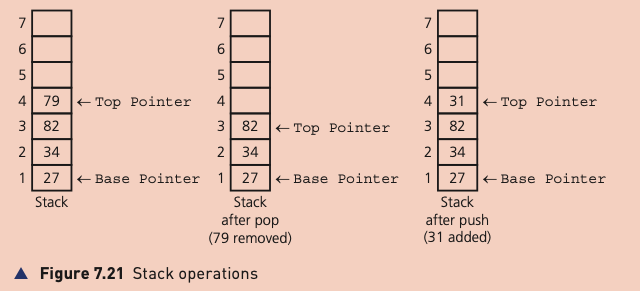
A pop removes the item currently at the top. A push adds a new item at the top. Because the last item placed on the stack is the first one removed, a stack follows LIFO.
Queue pointers and operations
A queue uses a Front Pointer and an End Pointer. In the source example, both pointers can change during queue operations.
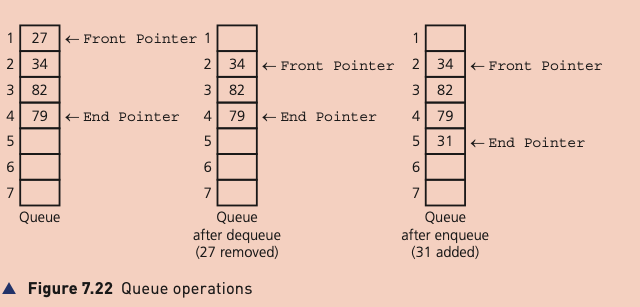
A dequeue removes the item at the front. An enqueue adds a new item at the end. The first item added is therefore the first item removed, which is FIFO.