Worked example · Easy
Complete a table
Find \(y\) when \(x=-1,0,1,2\) for \(y=x^2-2x-3\).
Values are \(0,-3,-4,-3\). These produce points \((-1,0),(0,-3),(1,-4),(2,-3)\).
Draw and interpret important function graphs, use graphs to solve equations, recognise growth and decay, and estimate the gradient of a curve using a tangent.
Subtopic 1
Make a table of values on both sides of the turning point, plot accurately and join with a smooth curve. The roots are the x-coordinates where the graph crosses or touches the x-axis.
For \(y=x^2-4x+3\), find the roots and turning point.
A quadratic function has the form \(y=ax^2+bx+c\). Its graph is a smooth curve called a parabola. A positive \(a\) gives a U-shaped curve; a negative \(a\) turns it upside down.
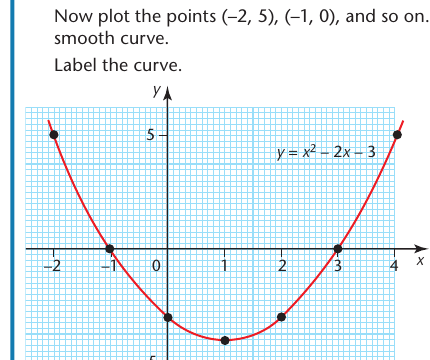
Find \(y\) when \(x=-1,0,1,2\) for \(y=x^2-2x-3\).
Values are \(0,-3,-4,-3\). These produce points \((-1,0),(0,-3),(1,-4),(2,-3)\).
The graph of \(y=x^2-2x-3\) crosses the x-axis at \(x=-1\) and \(x=3\). Solve \(x^2-2x-3=0\).
At the x-axis, \(y=0\), so the roots are \(\boxed{x=-1,\ 3}\).
Subtopic 2
To solve \(f(x)=k\), draw the horizontal line \(y=k\) and read the x-values at intersections. More general equations may need rearranging into a form visible on the plotted graph.
Using a graph of \(y=x^2-2x-3\), solve \(x^2-2x-3=5\).
Graphs solve equations through intersections. To solve \(f(x)=0\), read the x-values where the curve crosses the x-axis. To solve \(f(x)=k\), draw the horizontal line \(y=k\). For an equation such as \(f(x)=g(x)\), draw both graphs and read their intersection x-values.
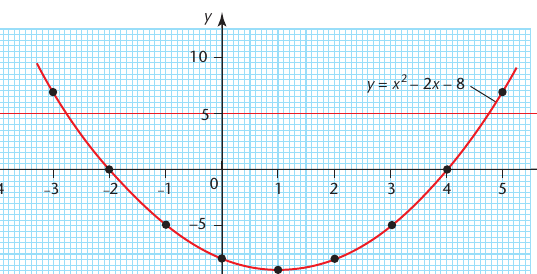
For \(f(x)=x^2-2x-8\), the graph meets \(y=5\) at approximately \(x=-2.7\) and \(x=4.7\).
So \(x^2-2x-8=5\) has approximate solutions \(\boxed{-2.7,\ 4.7}\).
You already have the graph of \(y=2x^2-x-3\). Explain how to solve \(2x^2-x=x+5\).
Subtract 3 from both sides:
\[2x^2-x-3=x+2\]Draw the line \(y=x+2\). Read the x-coordinates where it intersects the existing curve.
Subtopic 3
Cubic curves may have one or three real x-intercepts. The sign of the leading coefficient determines end behaviour. Make a careful table and plot enough points to capture turning points.
For \(y=x^3-4x\), find the x-intercepts.
Cubic functions contain an \(x^3\) term. A basic positive cubic such as \(y=x^3\) runs from bottom-left to top-right and has a characteristic double bend.
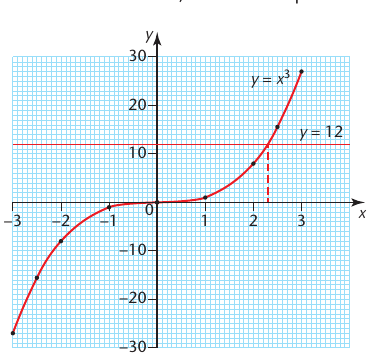
The line \(y=12\) meets \(y=x^3\) at about \(x=2.3\).
Therefore \(x^3=12\) has graphical solution \(\boxed{x\approx2.3}\).
A graph of \(y=x^3-2x\) crosses the x-axis three times. What does that tell you?
The equation \(x^3-2x=0\) has three real roots. From the textbook graph they are approximately \(\boxed{-1.4,0,1.4}\).
Subtopic 4
A reciprocal graph \(y=k/x\) cannot have \(x=0\); its branches approach the axes but never cross them when \(k e0\). Use values of both signs when plotting.
For \(y=12/x\), find points when \(x=-3,2,6\).
Reciprocal functions include \(y=\frac{a}{x}\) and \(y=\frac{a}{x^2}\). Since division by zero is undefined, \(x=0\) is excluded. The curves approach the axes but do not meet them.
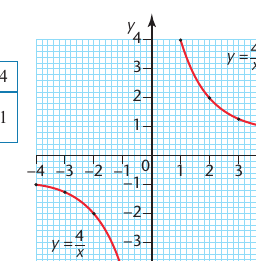
For \(y=\frac{a}{x}\), the two branches lie in opposite quadrants if \(a>0\). For \(y=\frac{a}{x^2}\) with \(a>0\), both branches lie above the x-axis.
Explain why \(y=\frac4x\) cannot have a point where \(x=0\).
It would require \(4\div0\), which is undefined. Therefore \(x=0\) is not in the domain.
Subtopic 5
Recognise the shape from the equation and the domain. Square-root functions require a non-negative radicand for real values; compare graphs of \(\sqrt x\) and \(\sqrt{x-a}\).
For \(y=2\sqrt{x}\), calculate \(y\) at \(x=0,4,9\).
The chapter also includes root functions and functions that combine different powers of x. A square-root graph is restricted to values of x for which the expression under the root is non-negative.
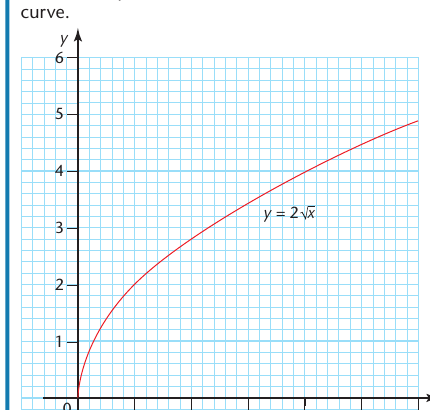
Why is \(x=-4\) not used on the real graph of \(y=2\sqrt{x}\)?
\(\sqrt{-4}\) is not a real number, so the real graph only uses \(\boxed{x\ge0}\).
Why can a function containing \(1/x\) change very rapidly close to \(x=0\)?
As \(x\) gets close to zero, \(|1/x|\) becomes very large, so the reciprocal term dominates the shape.
Subtopic 6
For \(y=a^x\), the y-intercept is 1. With \(a>1\) the curve increases, and when \(0
For \(y=3^x\), evaluate at \(x=-1,0,2\).
An exponential graph has a variable in the exponent, for example \(y=ka^x\). For \(a>1\), the values grow increasingly quickly as x increases.
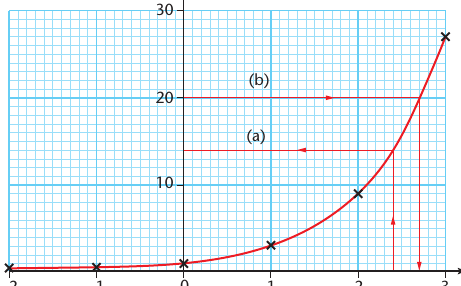
From the textbook graph of \(y=3^x\), estimate y when \(x=2.4\).
The graph gives approximately \(\boxed{14}\).
Use the same graph to solve \(3^x=20\).
Draw \(y=20\) and read the x-value at the intersection: \(\boxed{x\approx2.7}\).
Subtopic 7
Translate a percentage change into a multiplier before drawing or interpreting a graph: growth \(1+r\), decay \(1-r\), where \(r\) is the decimal rate. Repeated changes use powers.
A population of 4000 grows 5% each year. Estimate after 3 years.
Functions of the form \(P=A\times b^x\) model repeated percentage change. If \(b>1\), the graph shows growth. If \(0 What does 1.05 mean in \(P=700(1.05)^x\)? \(1.05=105\%\), so the quantity increases by \(\boxed{5\%}\) each period. The population model above is graphed. Estimate the population after 5.5 years. Reading at \(x=5.5\) gives about \(\boxed{920}\).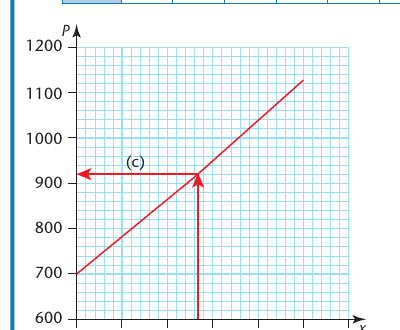 Worked example · Medium
Interpret a multiplier
Worked example · Exam-styleEstimate from a growth graph
Subtopic 8
At a specific point on a curve draw a tangent, not a chord; choose two points far apart on the tangent and compute the rise over run. State negative gradients with the correct sign.
A tangent passes approximately through \((1,3)\) and \((5,15)\). Estimate the curve gradient.
A curve does not have one constant gradient. To estimate its gradient at a particular point, draw a tangent that just touches the curve there, then calculate the tangent's gradient.
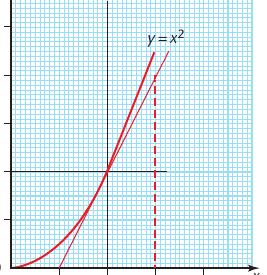
A tangent to \(y=x^2\) at \((2,4)\) passes approximately through \((1,0)\) and \((3,8)\). Estimate the gradient.
Attempt each question before opening the answer. For graph-drawing questions, the answer describes the points and features your graph should show.
For \(y=x^2-4\), find y when \(x=-2,-1,0,1,2\).
\(0,-3,-4,-3,0\).
A quadratic graph crosses the x-axis at \(-3\) and \(5\). Solve \(f(x)=0\).
\(\boxed{x=-3\text{ or }x=5}\).
You have drawn \(y=x^2+x-2\). What line should you draw to solve \(x^2+x-2=4\)?
Draw \(\boxed{y=4}\).
You have drawn \(y=x^2-3x\). What line can be added to solve \(x^2-3x=x+2\)?
Draw \(\boxed{y=x+2}\). The intersection x-values solve the equation.
Describe the overall direction of \(y=x^3\).
It runs from bottom-left to top-right with a double bend.
Why is \(x=0\) excluded from \(y=7/x\)?
Division by zero is undefined.
For \(y=2/x^2\), is y positive or negative when \(x=-3\)?
So it is positive.
State the real domain of \(y=3\sqrt{x}\).
\(\boxed{x\ge0}\).
Does \(y=500(1.08)^x\) model growth or decay?
Growth, because the multiplier is greater than 1.
What percentage change is represented by multiplier 0.84?
\(0.84=84\%\), so it is a \(\boxed{16\%\text{ decrease}}\).
For \(P=1200(1.03)^x\), what is P when \(x=0\)?
To solve \(2^x=15\) from a graph of \(y=2^x\), what line should you draw?
Draw \(\boxed{y=15}\).
A tangent passes through \((2,5)\) and \((8,17)\). Find its gradient.
Why is a tangent used instead of the whole curve to estimate gradient at one point?
The curve's gradient changes, while the tangent represents the local direction at that point.
You have drawn \(y=x^3-2x\). Explain how to solve \(x^3-2x=3\).
Draw the horizontal line \(y=3\), then read the x-coordinate(s) where it intersects the cubic curve.
Why should extra x-values near zero often be plotted for functions containing \(1/x\)?
Because the reciprocal term changes very rapidly close to zero, so extra points are needed to show the curve's shape accurately.
A table gives two equal lowest y-values at consecutive x-values. Why might an extra midpoint x-value be useful?
The true turning point may lie between them and have an even lower y-value. The midpoint helps locate the turning point more accurately.
A car's value is modelled by \(V=5000(0.85)^t\). State the initial value and annual percentage decrease.
Initial value: \(\boxed{5000}\). Multiplier 0.85 means the car retains 85%, so it decreases by \(\boxed{15\%}\) each year.
I calculate values accurately and use enough points to show the correct curve shape.
I know which extra line or curve to draw and read x-values at intersections.
I recognise quadratic, cubic, reciprocal, root and exponential shapes.
I remember that reciprocal graphs exclude x = 0 and square-root graphs may restrict x.
I interpret exponential multipliers correctly.
I estimate the gradient of a curve by drawing a good tangent and using two well-spaced points.