3.2 Input and output devices
This large topic explains how common input and output devices work, why particular devices are chosen for particular applications, and how sensors, ADCs, DACs, microprocessors and actuators are combined in monitoring and control systems.
What you need to understand
You should be able to describe how the named input and output devices work and where they are used, compare suitable devices for a task, explain sensor systems and analogue/digital conversion, and trace monitoring and control processes using stored values, feedback and actuators.
Input devices
Input devices allow data to enter a computer system. In this topic the textbook covers barcode and QR-code scanners, digital cameras, keyboards, microphones, optical mice, 2D and 3D scanners and three touch-screen technologies.
Barcode scanners (readers)
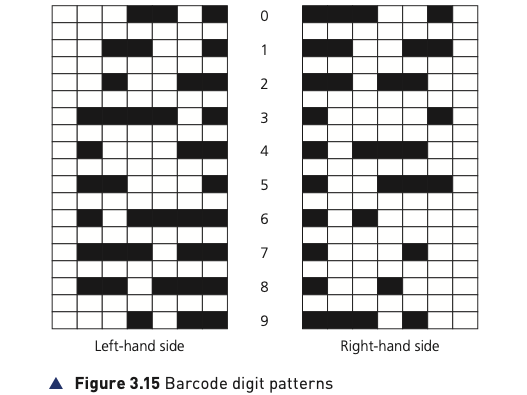
A barcode represents digits using dark and light bars of different widths. The textbook example uses different patterns on the left and right sides of the code, separated by guard bars. Each digit contains two dark and two light lines; left-side digits begin with a light element and use an odd number of dark elements, while right-side digits begin with a dark element and use an even number. This helps the code to be read in either direction.
How a barcode is read
- A red laser or LED scans the barcode.
- Light areas reflect more light; dark bars reflect little or none.
- Photoelectric cells detect the reflected pattern.
- The changing light pattern is converted into digital data so the computer can identify the digits.
At a supermarket checkout
The barcode number is used as a key field to look up the stock record. The price and item details are returned to the point-of-sale terminal, stock quantity is reduced, the new stock value is written back to the database and compared with the re-order level. If the level is reached, more stock can be ordered automatically and a flag prevents repeated re-ordering until new stock arrives.
Management benefits
Faster price changes, up-to-date sales information, automatic stock control, no need to price every item individually, and easier analysis of buying habits when linked to loyalty cards.
Customer benefits
Faster queues, fewer pricing errors, an itemised bill, possible cost savings and improved tracking of sell-by dates.
Barcodes are also used in libraries to link a borrower to a book and to track its return date.
Quick response (QR) codes
A QR code is a two-dimensional matrix of light and dark squares. The book notes that it can hold far more information than a conventional barcode, including web addresses. Three large corner squares provide alignment; another smaller corner square helps the reader determine the correct size and camera angle.

How a QR code is used
- A phone or tablet camera captures the code.
- The QR app converts the square pattern into readable data.
- Browser or phone software interprets the decoded information.
- The user may be taken to a website, telephone number or electronic boarding pass.
| Advantages over a traditional barcode | Disadvantages / risks |
|---|---|
| Stores much more information. | More than one QR format exists. |
| Higher capacity permits stronger error checking and redundancy. | Malicious code can be embedded; scanning may lead to fake sites, malware or unauthorised access. |
| Can be read by ordinary phone/tablet cameras rather than specialised laser readers. | Users may scan codes without knowing where they lead. |
| Easy to transmit as an image or message and can be encrypted. | — |
The source also introduces frame QR codes, which provide a canvas area for graphics or advertising logos within the code.
Digital cameras
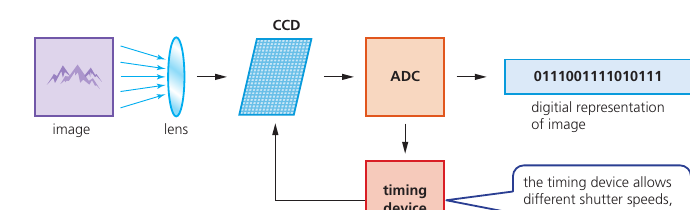
Digital cameras use an embedded system to control functions such as shutter speed, autofocus, flash, aperture, image size and red-eye correction. When a picture is taken, light passes through the lens onto a light-sensitive array made from millions of tiny sensors/photodiodes (CCDs).
- Light is converted into tiny electrical charges by the sensor array.
- An analogue-to-digital converter (ADC) converts those charges into digital brightness values.
- Colour is also measured. The source describes a 24-bit RGB system with 8 bits for red, 8 for green and 8 for blue.
- The number of pixels influences file size and image detail; quality also depends on lens quality, sensor quality, lighting and the storage format.
Keyboards
Keyboards remain a common way to enter text. Each pressed character corresponds to a code such as its ASCII value. They are relatively slow and can introduce typing errors; frequent use can also contribute to repetitive strain injury (RSI), which ergonomic keyboards are designed to reduce.
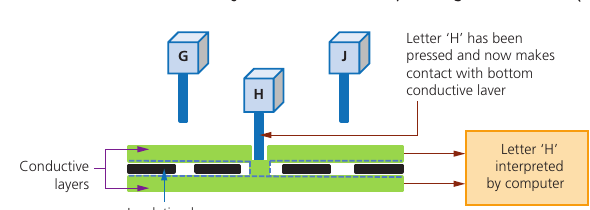
Under the keys is a membrane or circuit board. Pressing a key completes an electrical circuit. The CPU identifies which circuit was completed, refers to an index mapping and interprets the corresponding character.
Microphones
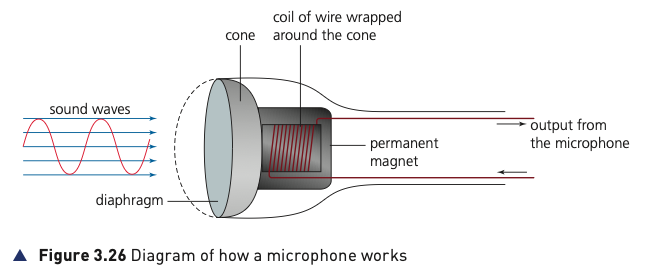
A microphone converts sound waves into an analogue electrical signal. Sound vibrates a diaphragm; the attached cone and coil move backwards and forwards through a permanent magnetic field, inducing an electric current. A sound card or ADC can then convert that analogue current into digital values that a computer can store or process.
Optical mouse
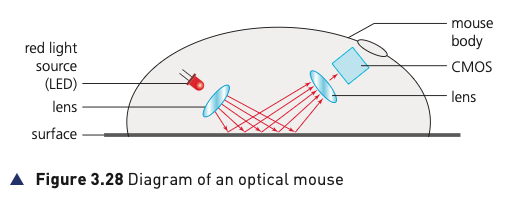
An optical mouse is a pointing device. The source describes a red LED illuminating the surface and a CMOS sensor capturing reflected patterns. A digital signal processor analyses changes between images and calculates movement coordinates so the on-screen pointer can move.
Compared with an older mechanical mouse, there are no moving parts, dirt is less likely to interfere with operation and no special mouse surface is required. A wired mouse avoids wireless signal loss, avoids batteries and can be cheaper to operate.
2D scanners
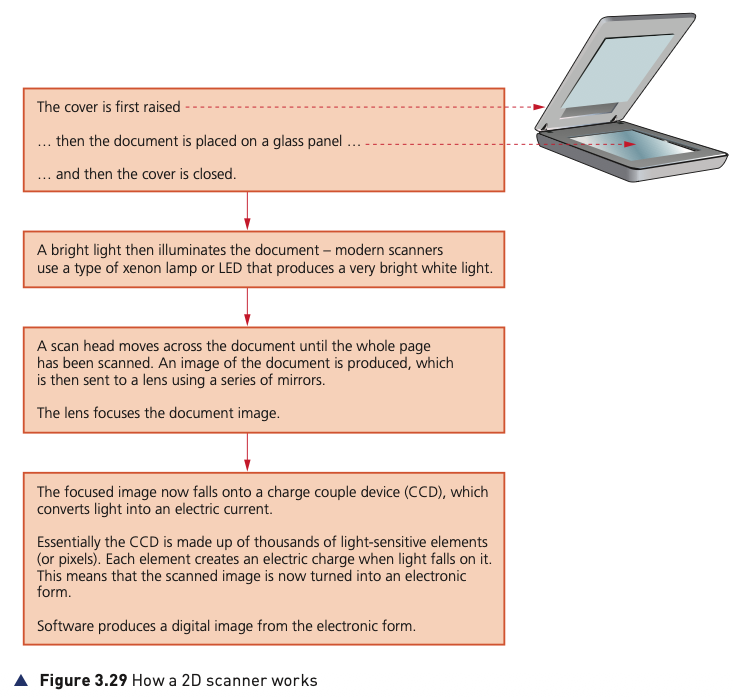
A 2D scanner converts a paper document or photograph into an electronic image. The document is placed on a glass panel, illuminated by a bright lamp or LED, and a scan head moves across it. Mirrors direct the image to a lens; a CCD converts the received light into electrical charges, and software builds the digital image.
OCR (optical character recognition) software can recognise scanned text and turn it into an editable text file. A scanned photograph can instead be stored as an image such as JPEG.
3D scanners and tomography
A 3D scanner records a solid object using measurements along x, y and z coordinates and produces a three-dimensional digital representation. The result can be used in CAD or sent to a 3D printer.
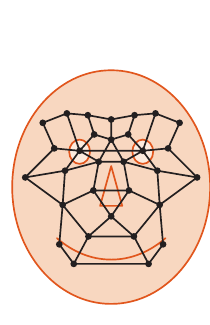
At airports, 2D scanning and OCR can read passport data. A scanned passport photograph can be compared with a newly captured facial image using measurements such as the distance between the eyes, nose width, cheek-bone shape, jaw length and eyebrow shape.
Computed tomography (CT) is an application of 3D scanning. A solid object is represented by a series of thin 2D slices, which are stored digitally and combined to represent the whole 3D object. The book also names MRI and SPECT as related tomographic techniques using different energy sources.
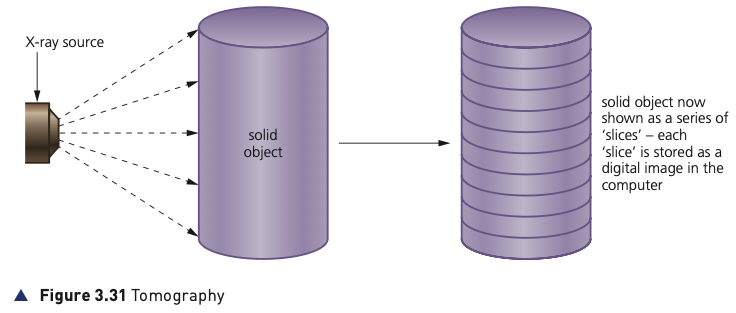
Touch screens
The source compares three technologies: capacitive, infrared and resistive.
Capacitive
A capacitive screen contains glass and a transparent conductive layer. Touching it changes the electrostatic field; a microcontroller calculates the point of contact. Surface capacitive systems use corner sensors and are generally limited to a bare finger or special stylus. Projective capacitive systems use an X–Y conductive matrix, can support multi-touch and can work with a wider range of touch inputs.
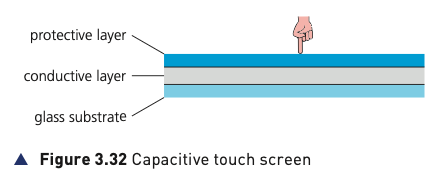
Advantages: good image clarity, durability, scratch resistance and multi-touch for projective systems. Drawbacks: surface capacitive systems require a suitable touch input and capacitive screens can be affected by electromagnetic radiation.
Infrared
Infrared transmitters and sensors form a grid around the screen. A touch blocks some beams, reducing the infrared signal at particular sensors; the microcontroller uses this to locate the touch.
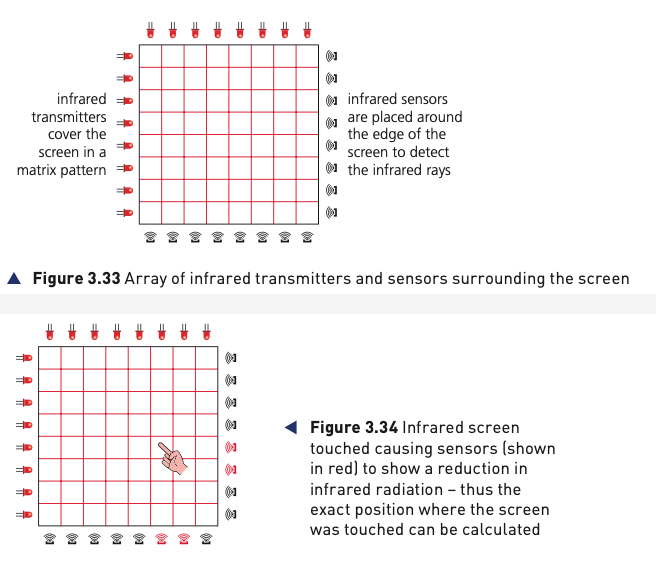
Advantages: multi-touch, durable and still usable if the screen is scratched or cracked. Drawbacks: sensitivity to water/moisture, accidental activation if beams are disturbed and possible light interference.
Resistive
Two resistive layers are separated by air or inert gas. Pressing the flexible upper layer makes the two coated surfaces touch, completing a circuit. The changed voltage identifies the touch position.
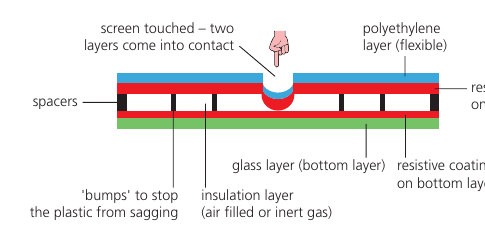
Advantages: good resistance to dust/water and works with fingers, stylus or gloves. Drawbacks: lower sensitivity, no multi-touch, poorer sunlight visibility and greater vulnerability to scratches.
Output devices
Output devices present or act on the results of computer processing. The textbook covers actuators, projectors, printers, screens and loudspeakers.
Actuators
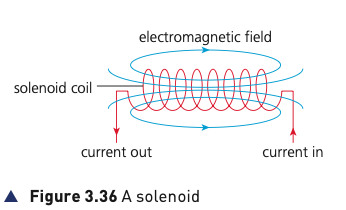
An actuator is a mechanical or electromechanical device that turns a computer-controlled signal into a physical action. Examples include relays, motors and solenoids. In a solenoid, current through a coil creates a magnetic field that can move a plunger in a straight line or, in some designs, rotate it.
Light projectors
Digital light projector (DLP)
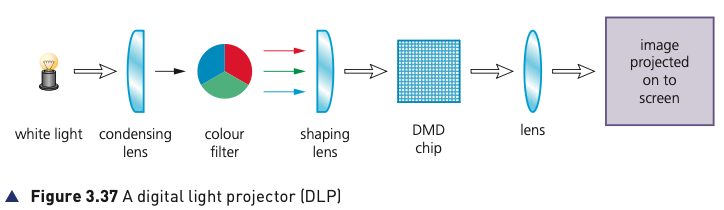
A DLP projector uses a digital micromirror device (DMD) containing a huge number of tiny mirrors. A mirror tilted toward the light source represents an ON state and one tilted away represents OFF. Repeated switching creates brightness levels; a colour filter provides red, green and blue components so a full-colour image can be projected.
Liquid crystal display (LCD) projector
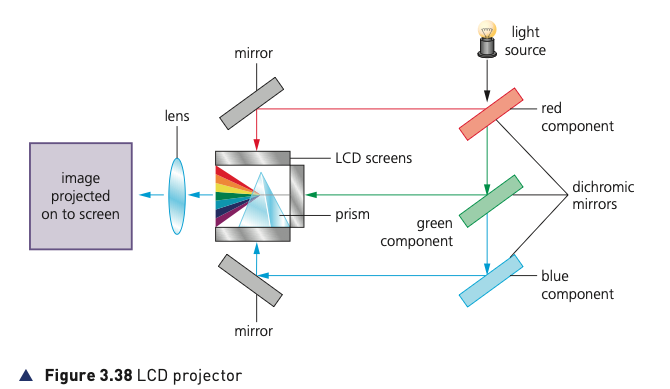
A powerful white light is separated into red, green and blue components by dichroic mirrors. Each colour passes through its own LCD panel to form a monochrome version of the image. A prism recombines the three coloured images, and the result is projected through the lens.
| DLP | LCD projector |
|---|---|
| Higher contrast, good reliability/longevity, quieter and often smaller/lighter. | Sharper image and better colour saturation. |
| Can suffer moving-image shadows and colour definition may be weaker. | Contrast may be lower; organic panels can degrade and have a limited life. |
| Well suited to dusty/smoky environments. | More energy-efficient and therefore usually produces less heat. |
Inkjet printers
An inkjet printer uses a print head containing nozzles, ink cartridges, a stepper motor/belt to move the head and a paper-feed system. The source describes two methods of creating ink droplets: thermal bubble, where heat creates expanding bubbles that eject ink, and piezoelectric, where a crystal vibrates to force ink from a nozzle.
- Document data is sent to a printer driver.
- The driver converts it to a form the printer understands and checks printer availability.
- Data is stored in a printer buffer.
- Paper is fed in; sensors detect missing or jammed paper.
- The print head moves across the page spraying the required mixture of ink.
- The paper advances slightly after each pass until the page is complete.
- Further buffered data is printed; when the buffer empties, the printer can interrupt the CPU to request more data.
Inkjet printers are appropriate for one-off photographs or small numbers of good-quality colour pages, where small cartridges and paper trays are not a problem.
Laser printers
Laser printers use powdered toner and static electricity and normally produce a whole page at once. A positively charged drum is scanned by a laser, which removes charge in areas corresponding to the page image. Positively charged toner sticks to the negatively charged image areas; the toner transfers to negatively charged paper and is permanently fused by heated rollers. A discharge lamp resets the drum.
Laser printers suit high-volume, fast, high-quality printing because they use larger toner cartridges and paper trays.
3D printers
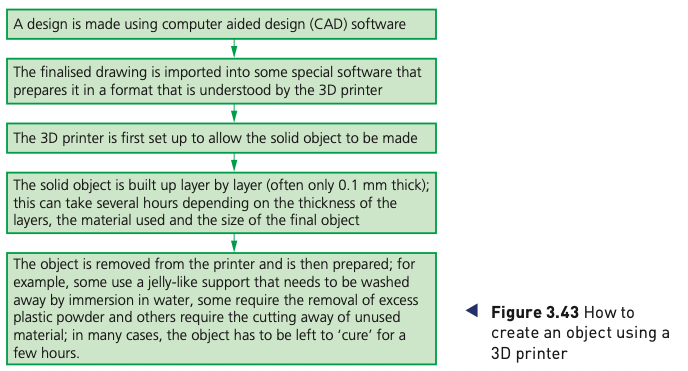
3D printers build solid objects layer by layer using materials such as powdered resin, powdered metal, paper or ceramic. This is additive manufacturing, unlike subtractive methods that remove material from a larger block.
- Direct 3D printing: a print head deposits material while moving in three dimensions.
- Binder 3D printing: one pass lays down powder and a second pass applies a binder to form the solid layer.
- Some newer methods use lasers or ultraviolet light to harden liquid polymers.
Uses given in the source include customised prosthetic-limb coverings, precision reconstructive-surgery parts, lightweight aerospace components, fashion/art and replacement parts for products that are no longer manufactured.
LED, LCD and OLED screens
LED screens
A true LED screen is made from tiny red, green and blue light-emitting diodes. Varying current changes their brightness and produces different colours. The source notes that these are commonly used for large outdoor displays.
LCD screens with LED backlighting
LCD pixels do not generate their own light, so a backlight is required. Modern LCD displays commonly use blue-white LEDs behind the LCD panel. Compared with older CCFL backlights, LEDs reach full brightness quickly, produce a whiter/brighter light, allow thinner displays, last longer and use less power.
OLED
Organic light-emitting diodes use organic semiconductor layers between electrodes. When an electric field is applied, the layers emit light, so no separate backlight is needed. OLED layers can be very thin and flexible.
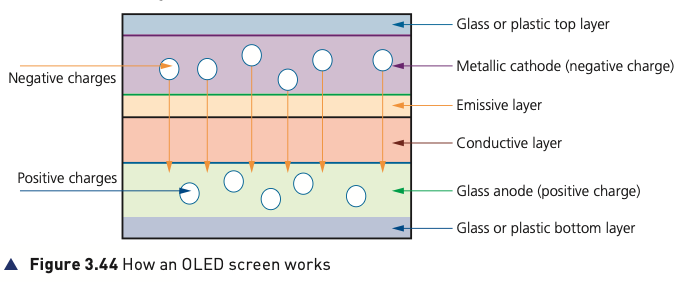
The source highlights thinner/lighter construction, flexibility, bright output, reduced power consumption due to no backlight and a wide viewing angle as advantages of OLED technology.
Loudspeakers
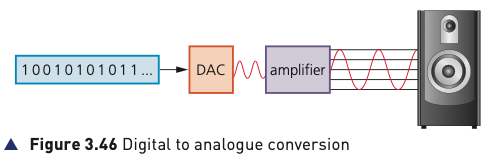
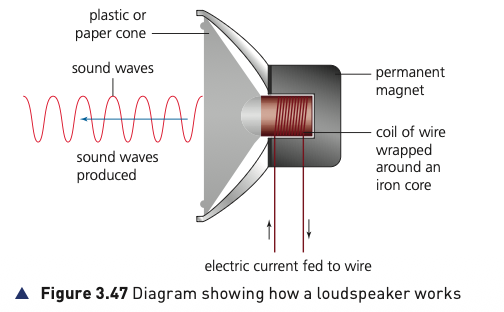
Digitally stored sound must be converted before it can drive an analogue loudspeaker. The digital data passes through a DAC, then an amplifier increases the current. In the speaker, current through a coil creates a changing magnetic field. Interaction with a permanent magnet moves the coil and attached cone, producing sound waves.
Sensors
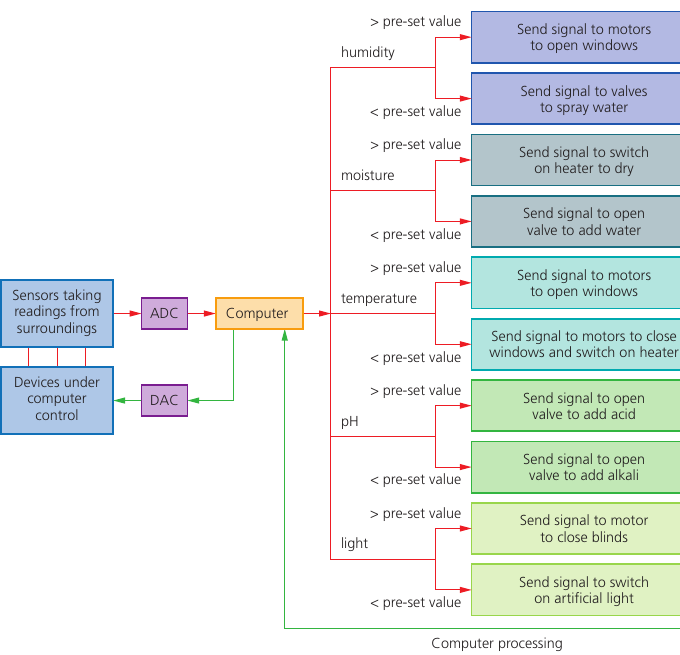
Sensors are input devices that measure physical properties in their surroundings. Real-world measurements are generally analogue, so an analogue-to-digital converter (ADC) may be required before a computer can process them. Where a computer must control an analogue device such as a motor or valve, a digital-to-analogue converter (DAC) may be required.
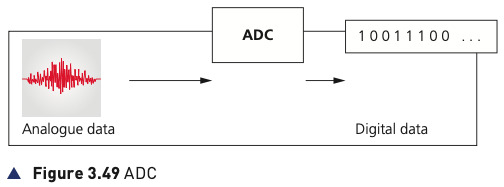
Sensors provide readings continuously. The computer or microprocessor samples and analyses the incoming data. In a control system, an output may change the environment and therefore alter the next sensor reading. This is feedback.
Common sensors and uses
| Sensor | What it measures / detects | Examples from the source |
|---|---|---|
| Temperature | Temperature of surroundings. | Central heating; chemical processes; greenhouse. |
| Moisture | Water level in a material such as soil, often using resistance. | Greenhouse soil; food-processing moisture. |
| Humidity | Water vapour in air. | Buildings; microchip factory; greenhouse. |
| Light | Brightness using photoelectric cells. | Street lights; automatic car headlights. |
| Active infrared | Whether an infrared beam has been interrupted. | Security systems; rain/windscreen applications. |
| Passive infrared | Heat radiation emitted by an object. | Body-heat security detection; freezer/chiller monitoring. |
| Pressure | Applied pressure, converted by a transducer. | Weighing lorries; reactor gas pressure. |
| Acoustic / sound | Sound converted to electrical signals. | Security footsteps; leaking pipe detection. |
| Gas | Gas concentration such as oxygen or carbon dioxide. | Airport pollution; greenhouse; car exhaust. |
| pH | Acidity/alkalinity. | Greenhouse soil; chemical processes. |
| Magnetic field | Changes in magnetic fields. | Mobile/CD applications; anti-lock braking. |
| Accelerometer | Acceleration and motion/change in velocity. | Airbags; phone screen orientation. |
| Proximity | Presence of a nearby object. | Switching off a phone screen when held near the face. |
| Flow rate | Rate of moving liquid or gas. | Respiratory devices; gas pipes. |
| Level | Liquid/material level using ultrasonic, conductivity, capacitance or other methods. | Fuel tank; pharmaceutical powder; leak detection. |
Monitoring versus control
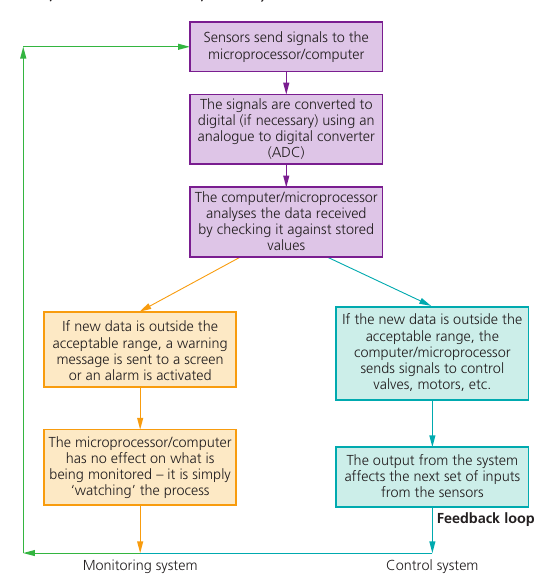
Both systems start with sensors sending data, conversion to digital if needed and comparison with stored values. The key difference is what happens next.
Monitoring
The computer watches the process. If a value is outside the acceptable range, it may display a warning or sound an alarm, but it does not directly change the process being observed.
Control
If a value is outside range, the computer sends signals to devices such as valves or motors. The output changes the process, which changes future sensor inputs — a feedback loop.
Monitoring applications
Security system
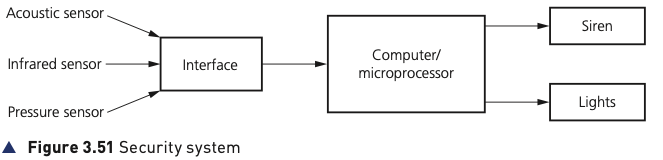
The source combines infrared, acoustic and pressure sensors. The sensor data is digitised if necessary and sampled by the computer. If a reading is outside the acceptable range, the computer can activate a siren or flashing light. A DAC may be used where the output device requires analogue control.
Hospital patient monitoring
Temperature, heart rate, breathing rate and other vital signs can be measured continuously. The computer samples the sensor data, compares it with entered acceptable ranges, displays values and raises an alarm if a reading moves outside the permitted range.
Control applications
Street lighting
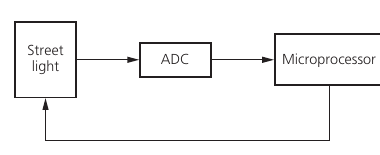
A light sensor sends readings through an ADC to a microprocessor. If the reading is below the stored threshold, the lamp is switched on; if it is at or above the threshold, it is switched off. The source includes a time delay between checks to prevent the lamp repeatedly switching because of brief changes such as cloud cover.
Anti-lock braking system (ABS)
Magnetic-field sensors monitor wheel rotation. If one wheel begins to lock, the microprocessor compares it with the other wheels and reduces braking pressure to that wheel. The process is repeated many times per second; braking pressure can be adjusted repeatedly to keep wheel speeds similar.
Central heating
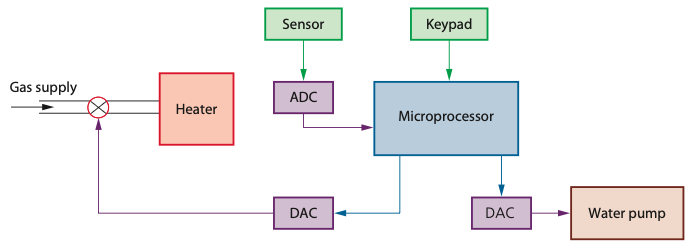
The required temperature is stored as a pre-set value. A temperature sensor sends readings through an ADC to the microprocessor. If the temperature falls below the pre-set value, the controller sends signals through DACs to actuators that open the gas valve and switch on the water pump.
Chemical process control
The source example requires a temperature above 70°C and pH below 3.5. Temperature and pH sensors feed data through an ADC. The computer compares each reading with its stored target and controls the heater and an acid valve through DAC-controlled outputs.
Greenhouse environment
The textbook example combines humidity, moisture, temperature, pH and light sensors. Each reading is compared with a stored value and the computer can open windows, spray water, switch on a heater, add water, add acid or alkali, close blinds or switch on artificial light. The process repeats continuously.